
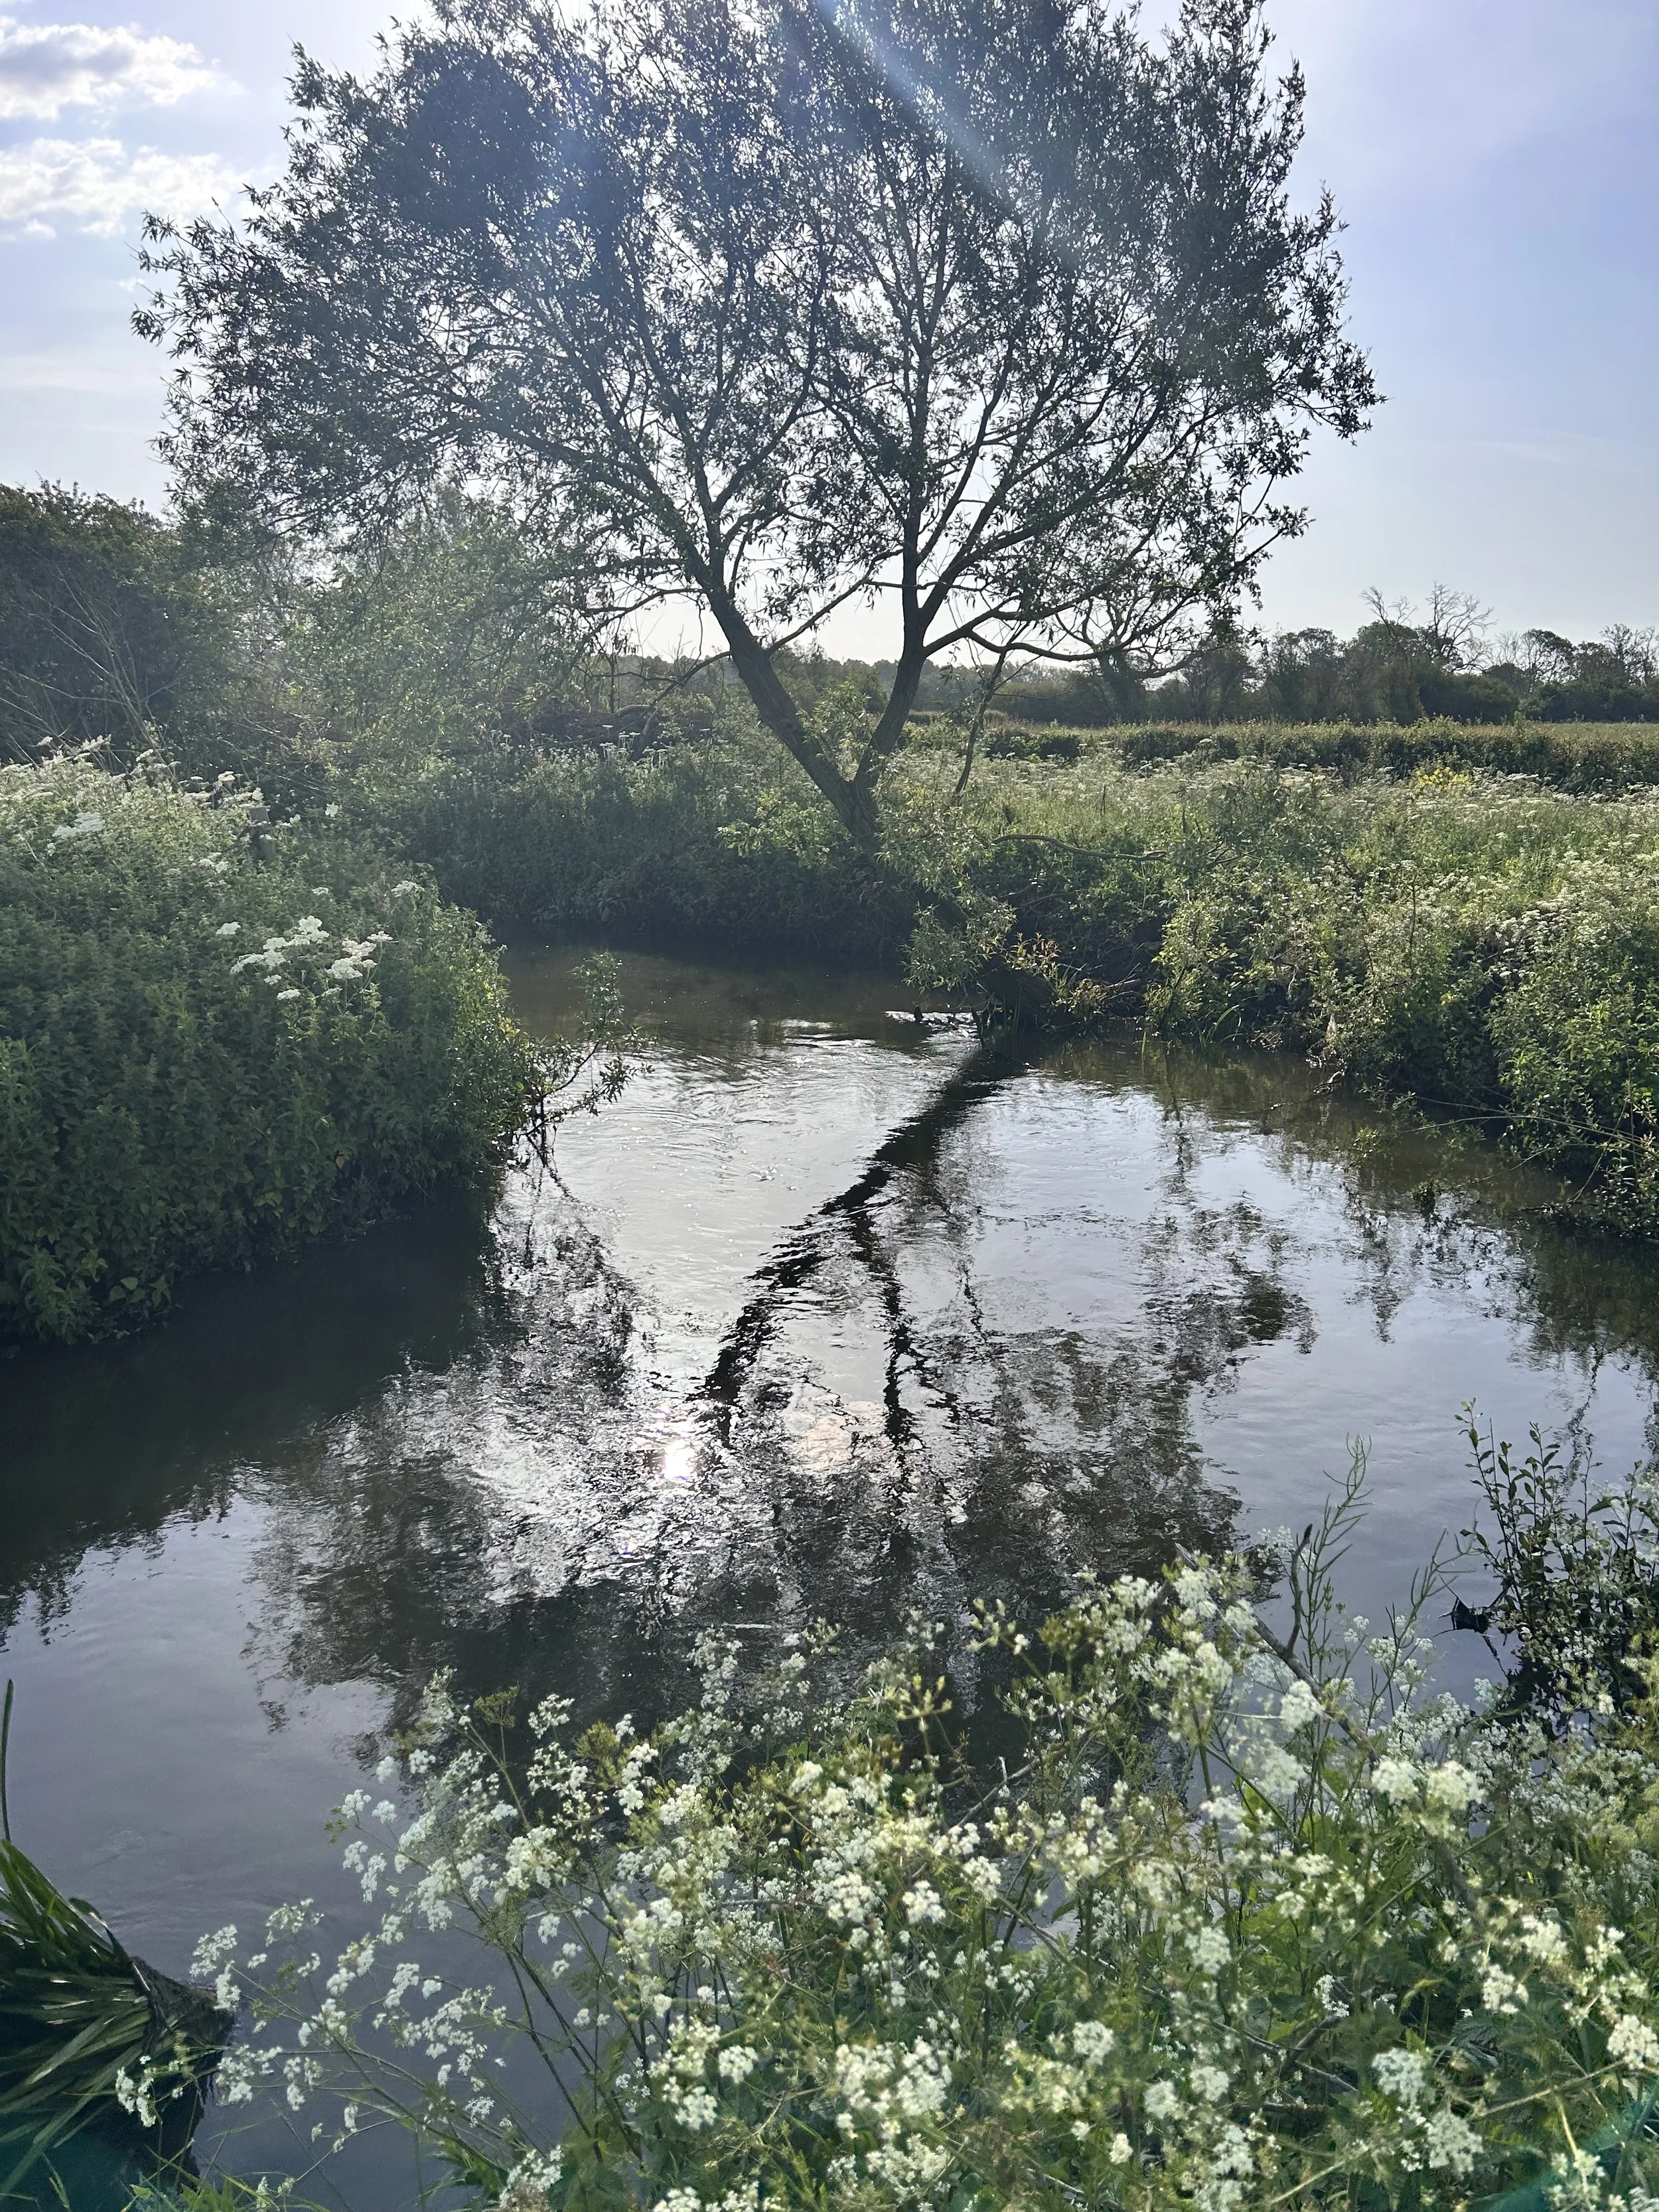
Rivers can look clear and “fine” even when they’re carrying dangerous levels of nutrient pollution. National monitoring leaves huge gaps, thousands of smaller waterways go untested, and only 14% of UK rivers are in good ecological health.
Citizen‑science fills those gaps by creating a long‑term, local record of what’s really happening beneath the surface.
Community testing helps us:
• Track pollution linked to sewage discharges and agricultural runoff, the biggest sources of nutrient loading in UK rivers.
• Build evidence that can’t be ignored by regulators or water companies.
• Spot changes early whether it’s a sudden ammonia spike or a slow rise in nutrients.
• Protect the places and waterways we love.
🧪 What Each Test Shows
Each parameter tells a different part of the river’s story. Together, they reveal whether a river is healthy, stressed, or in trouble.
Ammonia: the “fresh sewage” indicator
Ammonia is toxic to aquatic life and rises when recent sewage or slurry has entered the river. Citizen‑science groups across the UK use test strips and digital meters to monitor it because it’s one of the clearest signs of active pollution.
Nitrate: the long‑term pollution signal
Nitrates build up from fertilisers, manure, and older sewage that has already broken down. High nitrate levels are one of the most widespread problems found in national WaterBlitz surveys, with 60% of sites showing poor water quality due to nutrient pollution.
Phosphate: the ecosystem disruptor
Phosphate is a major driver of algal blooms and oxygen crashes. It often comes from sewage treatment works and agricultural runoff. Testing for phosphate is central to citizen‑science programmes because it’s a key pollutant that government monitoring frequently misses.
pH: the river’s chemical balance
A healthy river usually sits between pH 6.5 and 8.5. When nutrient pollution increases, pH often rises too. Volunteers use simple litmus strips or handheld meters to track these shifts, helping identify when the river is becoming chemically stressed.
Turbidity: clarity and sediment
Turbidity measures how cloudy the water is. High turbidity can indicate runoff, erosion, or disturbance from pollution events. It also affects fish, invertebrates, and plant life by reducing light and clogging gills. Many UK citizen‑science programmes include turbidity as a core test because it’s quick, accessible, and revealing.
Why Citizen‑Science Data Matters
Citizen‑science isn’t a hobby, it’s a national evidence base.
• Thousands of volunteers now test rivers across the UK, building datasets that are open, mapped, and used by researchers and campaigners.
• WaterBlitz events show the scale of the problem: in 2025, 81% of nutrient readings in the Thames basin were unacceptable.
• Local groups can pinpoint where pollution is happening, when it spikes, and what type of pollution it is, something national agencies often cannot do at this resolution.
This is the power of community science: it turns concern into evidence, and evidence into action.
What This Means for Clean River Action
For Leicester and Leicestershire, regular testing helps us:
• Document nutrient pressure on the River Soar and its tributaries.
• Build a timeline of pollution events, essential when challenging water companies or escalating to regulators.
• Empower volunteers with real, scientific tools.
• Show our community the truth: even when the river looks calm, it may be carrying a heavy pollution load.
Every test strip, every sample, every uploaded result strengthens the case for cleaner, safer rivers.
Want to help us test? Our next testing morning is in June or simply reach out for more info.